

The Relationship Between Stock Market Volatility and Stock Prices
The Relationship Between Stock Market Volatility and Stock Prices
Why Understanding Market Volatility can Help Investors Make Informed Decisions

Before we continue, I think it is important to establish how market volatility is tracked. Volatility is measured through an index commonly referred to as “The VIX”. The VIX is an index that tracks fear, uncertainty, and risk among investors in the short term. The important relationship to remember with the VIX is: When VIX increases, fear and uncertainty increases. When fear and uncertainty increase, selling pressure on stocks increases, often causes market selloffs.
VIXY is an ETF that tracks the VIX and is highly volatile itself. These large swings in volatility create opportunities for day traders to trade the volatility index itself and potentially make money off uncertain market conditions, but that is out of the scope of this piece. The important part is that we can compare VIXY to other index funds and stocks to see if this idea of “As volatility increases, stock prices decrease” holds up.
First up is comparing VIXY to the S&P 500 Index, also known as the SPY:
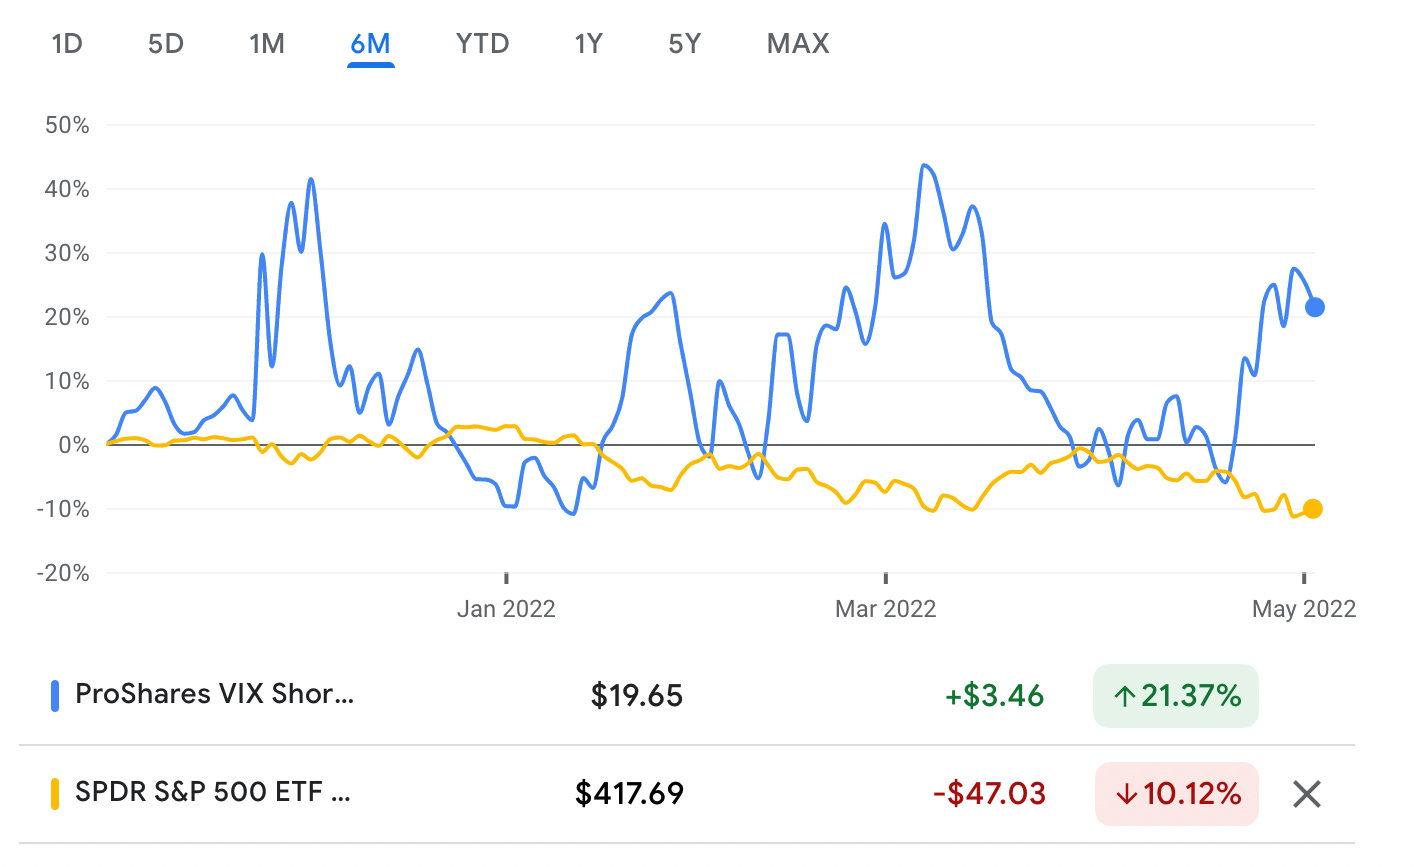
As you can see, there seems to be a relationship between VIXY and SPY. However, the movements in SPY are not as drastic as they are in the VIX. For every large swing in the VIX, there is a small swing in the opposite direction of the SPY.
Next, we will compare the VIXY to SPXL, an S&P 500 ETF that is 3x leveraged, so that every 1% the S&P moves, this ETF moves 3%, making it much more volatile. This ETF still tracks the exact same stocks as the S&P 500, but makes larger moves.
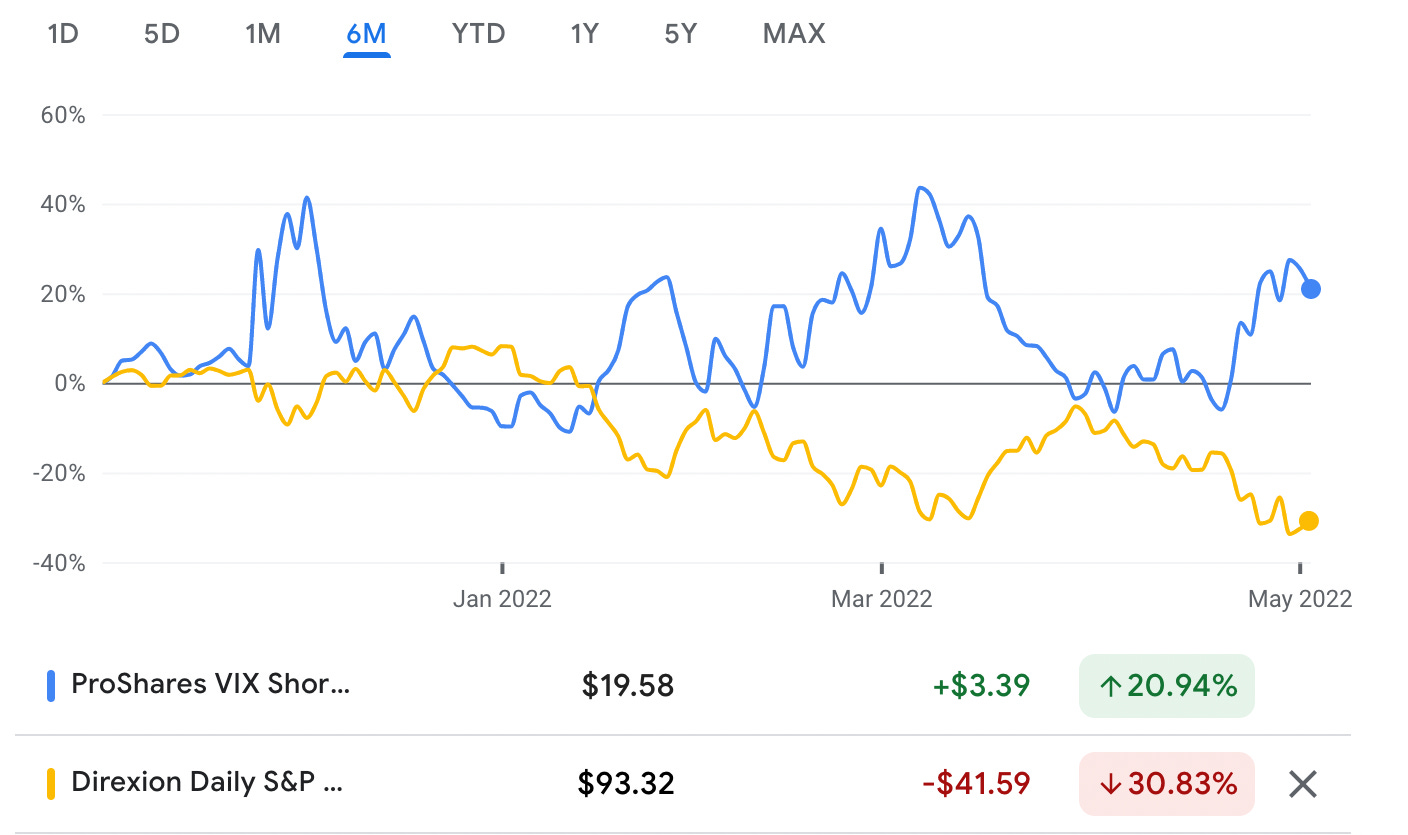
As you can see now, the inverse relationship of volatility and the S&P 500 is very close, made clear by the 3x leveraged ETF. The movements in the two are nearly perfectly mirrored, but why is this?
As mentioned before, volatility measures fear, uncertainty, and risk. When these factors increase in the stock market, fund managers look to sell their holdings to prevent future losses, and wait until the uncertainty clears to buy back in. When large fund managers sell, we see stock prices fall, much like we have seen to start 2022. Thus, volatility decreases once these fears and uncertainties have left the market, made obvious by looking at the comparison of the VIX to the S&P 500. We see that as the VIX decreases, stock prices increase, strengthening this inverse relationship idea we have.
In a way, the VIX is a self-fulfilling prophecy. Because the VIX rises, investors sell their stocks, causing volatility to increase even more, causing more investors to sell, and so on. Once investors decide the fear and uncertainty is over, investors buy, causing volatility to drop, and more investors start buying, and so on. This cycle seems to rinse and repeat a few times each year.
Why is understanding the inverse relationship for market volatility and stock prices important? For long term investors, high volatility can be a signal to allocate more to buying stocks or index funds than usual, creating the opportunity for better future returns. For short term traders, playing volatility can be very profitable, if you understand the risk being taken. For passive investors, this can serve as a nugget of knowledge to sound smarter. Short term volatility is nothing to stress about, but instead see it as an opportunity to grow your portfolio.